Simulate the fleet before you commit.
Upload your facility layout, task list, and robot specs. Get a Pareto set of task allocations that trade off cost, makespan, and reliability — before you buy or reconfigure a single unit.
- NSGA-II search
- Monte Carlo validation
- Per-robot schedules
Illustrative sample · 24 tasks · 6 robots · 60 generations · sample wall-clock 3.8 s. Values are synthetic; the frontier and knee point are computed from the per-generation candidates.
What the Tool Does
Rigorous stochastic multi-objective allocation engineering for industrial autonomy.
Full Parametric Ingestion
Takes a facility layout (locations + distances), a list of tasks, and robot specifications (speed, battery, payload, success rates by task type, operating cost).
Monte Carlo Validation
Simulates each candidate assignment with Monte Carlo runs that include travel-time variance, task-duration variance, success/failure, battery drain, and automatic charging.
NSGA-II Optimization
Searches the space of task-to-robot allocations with a multi-objective genetic algorithm (NSGA-II) instead of returning a single “best” plan.
Full Pareto Frontier
Produces the full Pareto front — the set of solutions that trade off cost, makespan, and reliability — so you can see the real compromises.
Granular Solution Output
Outputs, for every solution on the front: total cost, expected duration, overall success rate, and the concrete per-robot task schedule.
Heterogeneous Fleet Diagnostics
Works with heterogeneous fleets (different robot models in the same run) and flags when higher-capability robots are being used on simple tasks.
Example Report
Warehouse deployment trade-off analysis and stochastic schedule synthesis.
How to read these results
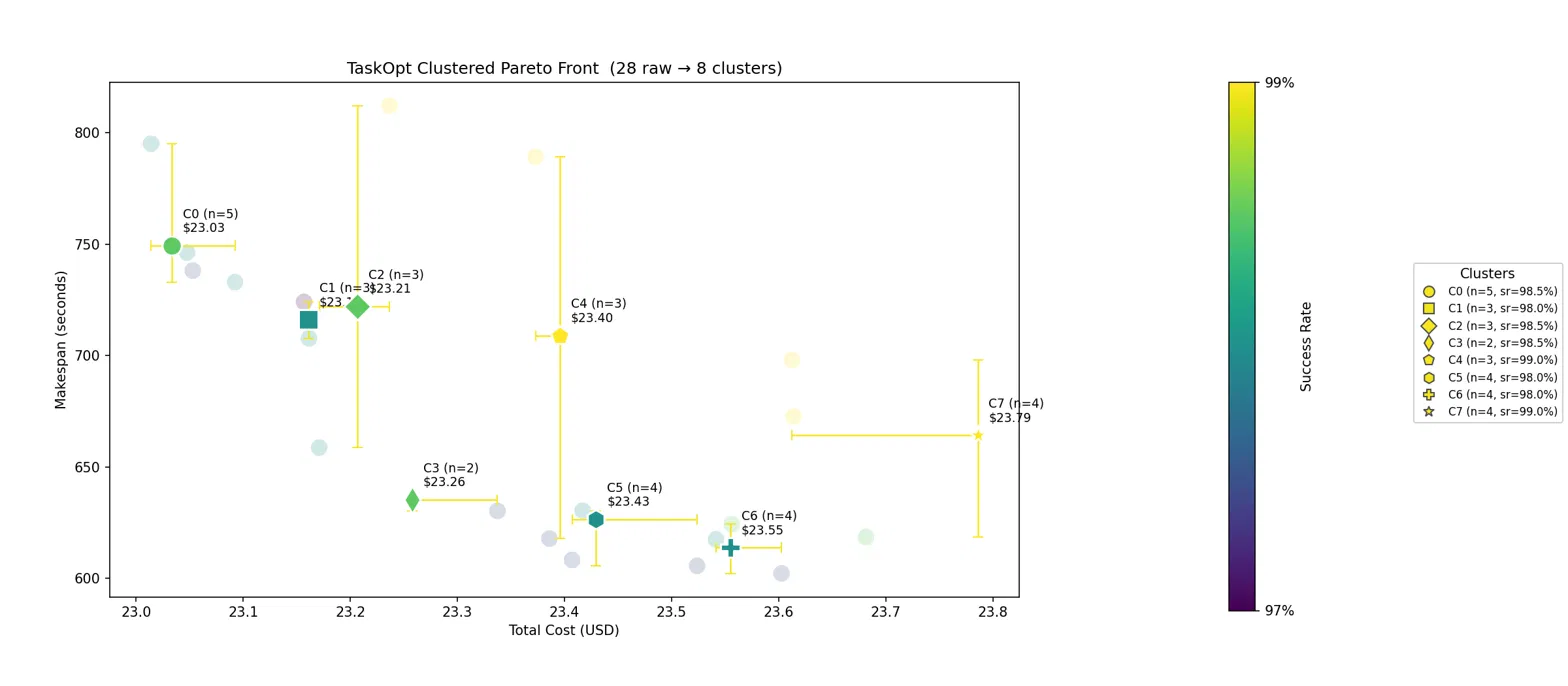
The chart above shows the Pareto front taskopt found for a warehouse deployment scenario: 28 raw solutions from the optimizer, grouped into 8 representative clusters, each trading off total cost against makespan (time to complete all tasks) at a given success rate. Rather than one "best" answer, taskopt surfaces the full range of viable trade-offs — a faster, more reliable deployment costs more; a cheaper one takes longer or accepts more risk.
The Gantt chart shows the lowest-cost solution from that front in detail: which robot is assigned which tasks, and in what order. Note the gap between nominal makespan (612s, a simple deterministic estimate) and Monte Carlo makespan (795s, averaged across stochastic trials) — that gap is real and expected, not an error. It comes from three sources: sampling noise inherent to any finite-trial simulation, battery recharge time (which extends the schedule but costs nothing, since idle charging has no dollar cost), and the fact that task order matters — the same task set assigned to the same robot produces different total time depending on the sequence, which is part of what the optimizer searches over.